Device ≠ circuit
The up-to-82% SET and 54% READ energy figures reported by Das et al. concern a HfO₂/CMOS 3T1R synapse circuit. They are not measured IGZO platform savings. Source ↗
EVIDENCE-LED RESEARCH ATLAS · 2026
An integrated, critical synthesis of IGZO resistive devices, analogue arrays, peripheral circuits, edge workloads, fabrication choices and system-level validation.
This is a research roadmap, not an announcement of a completed IGZO product or measured end-to-end advantage.
Explore the programme ↗
01 / CRITICAL FINDINGS
The up-to-82% SET and 54% READ energy figures reported by Das et al. concern a HfO₂/CMOS 3T1R synapse circuit. They are not measured IGZO platform savings. Source ↗
Naqi et al. fabricated a 10×10 IGZO array. Their CNN/SNN recognition rates are tied to electrical and network simulation; the same article reports approximately 500 cycles and >10⁴ s retention. Source ↗
The supplied project drafts include <1 ms, <1 W, 300× and 10⁶ cycles without project-specific raw system measurements. We retain them only as hypotheses or test targets.
02 / SYSTEM ARCHITECTURE
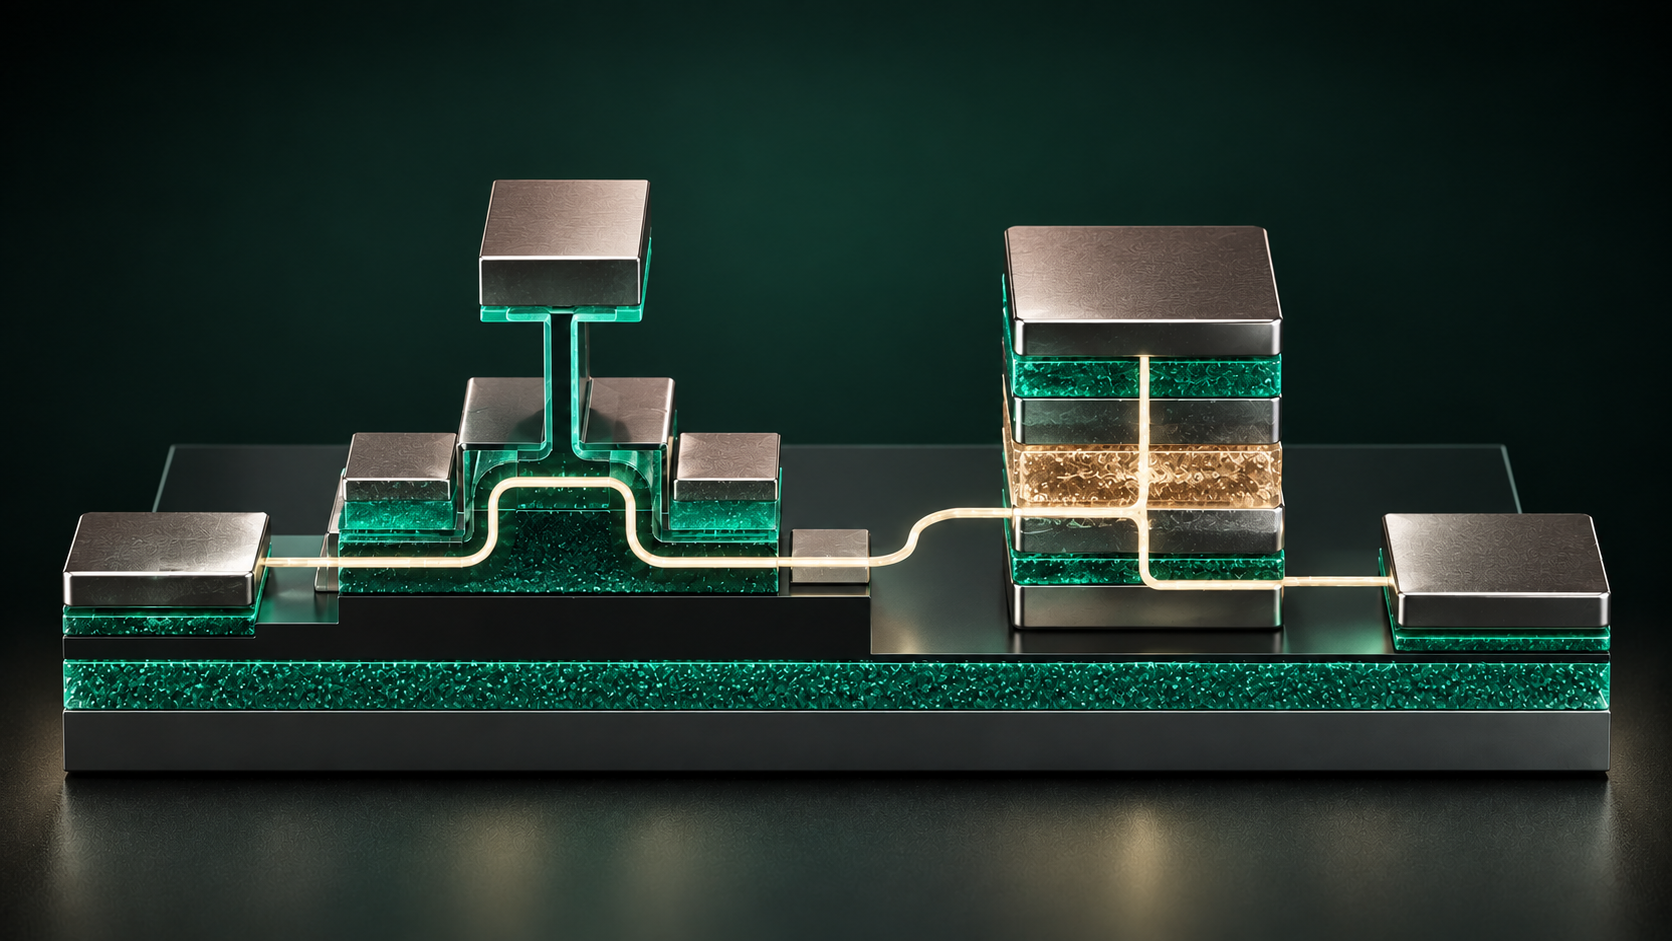
Film composition, electrode interface, conductance states, switching distributions, retention, endurance and read disturb.
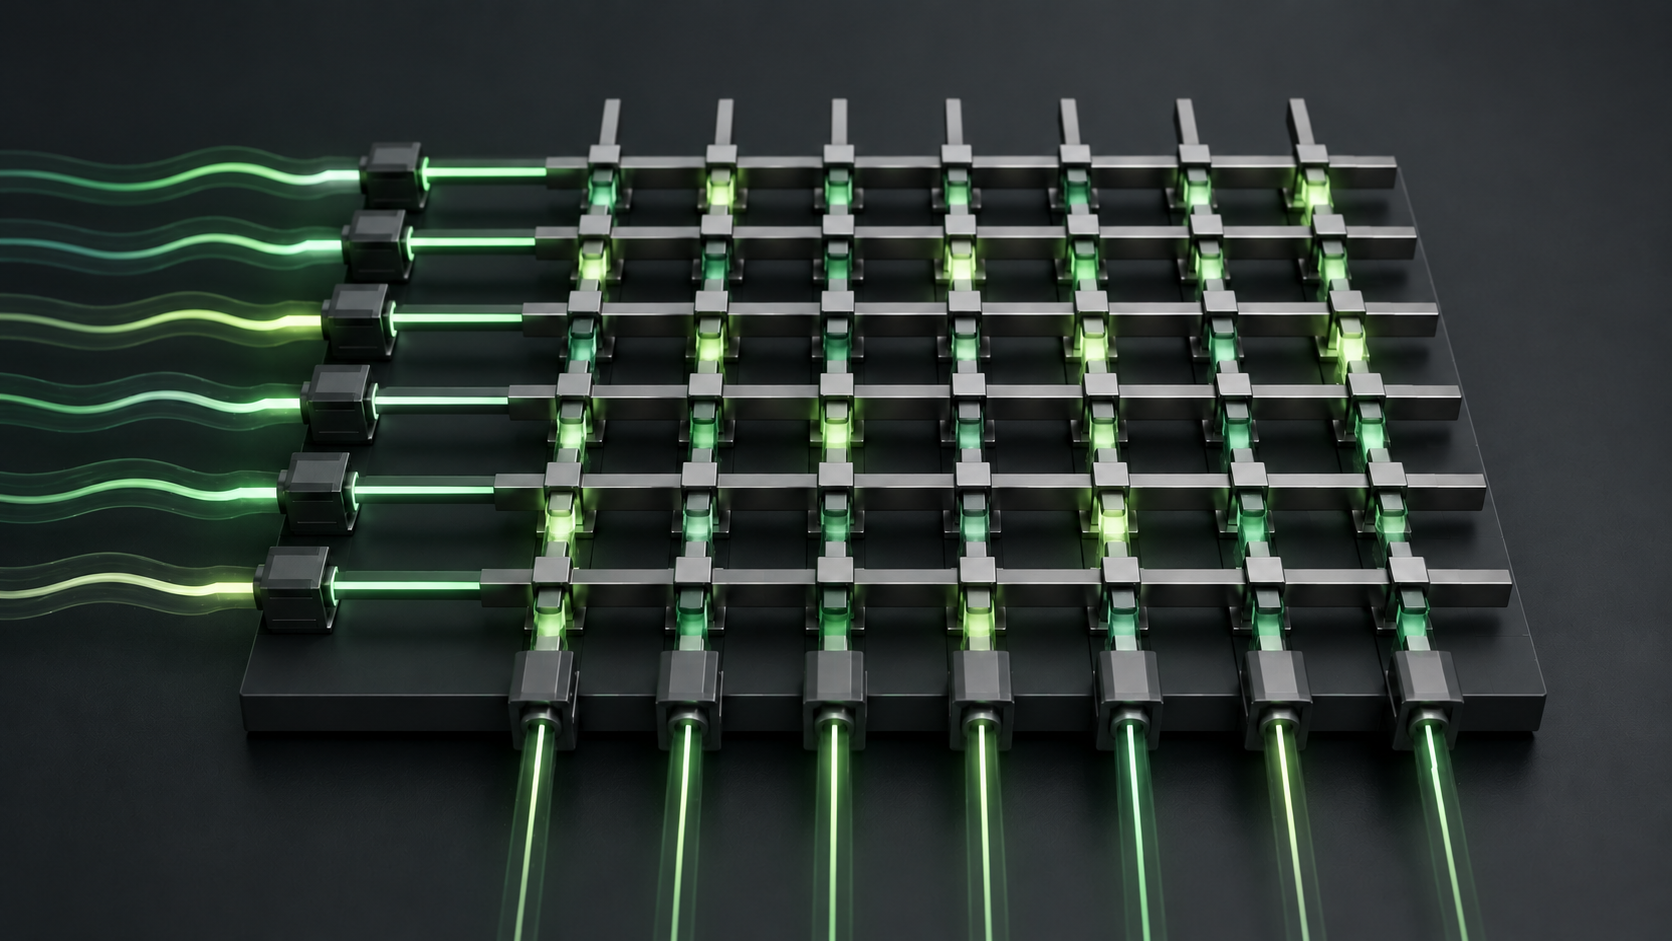
Vector–matrix multiplication, sneak paths, line resistance, selectors and array yield.
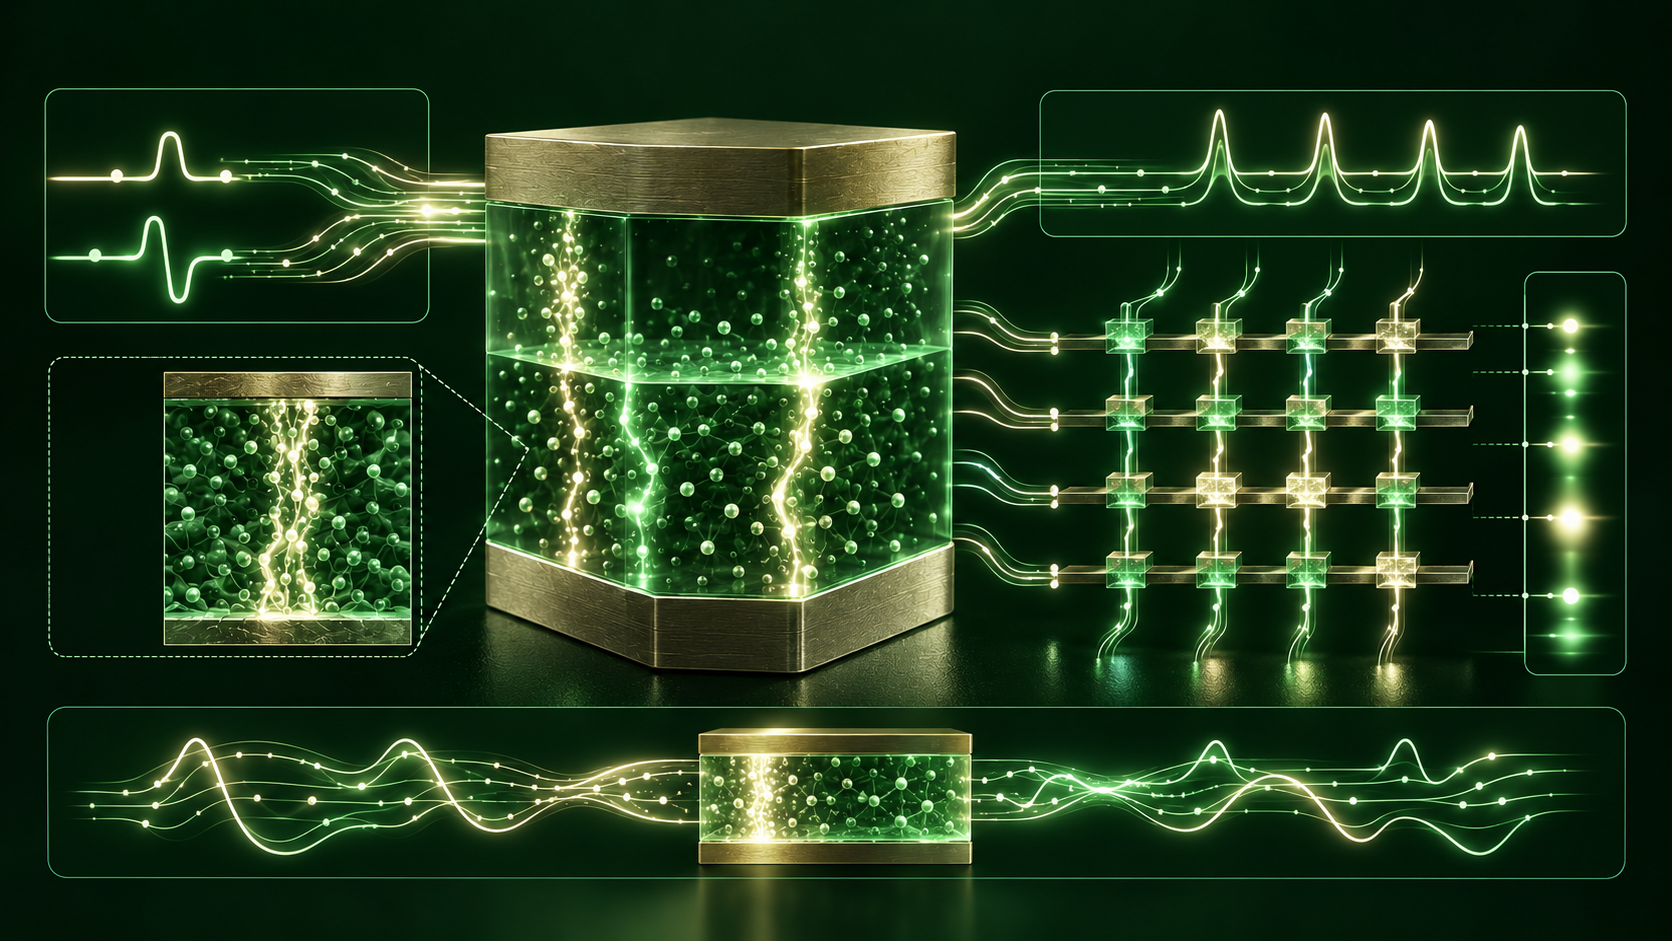
Programming pulses, current compliance, sensing, ADC/DAC, reference cells and peripheral energy.

Measured-device-aware training, weight encoding, programming verification and recalibration.
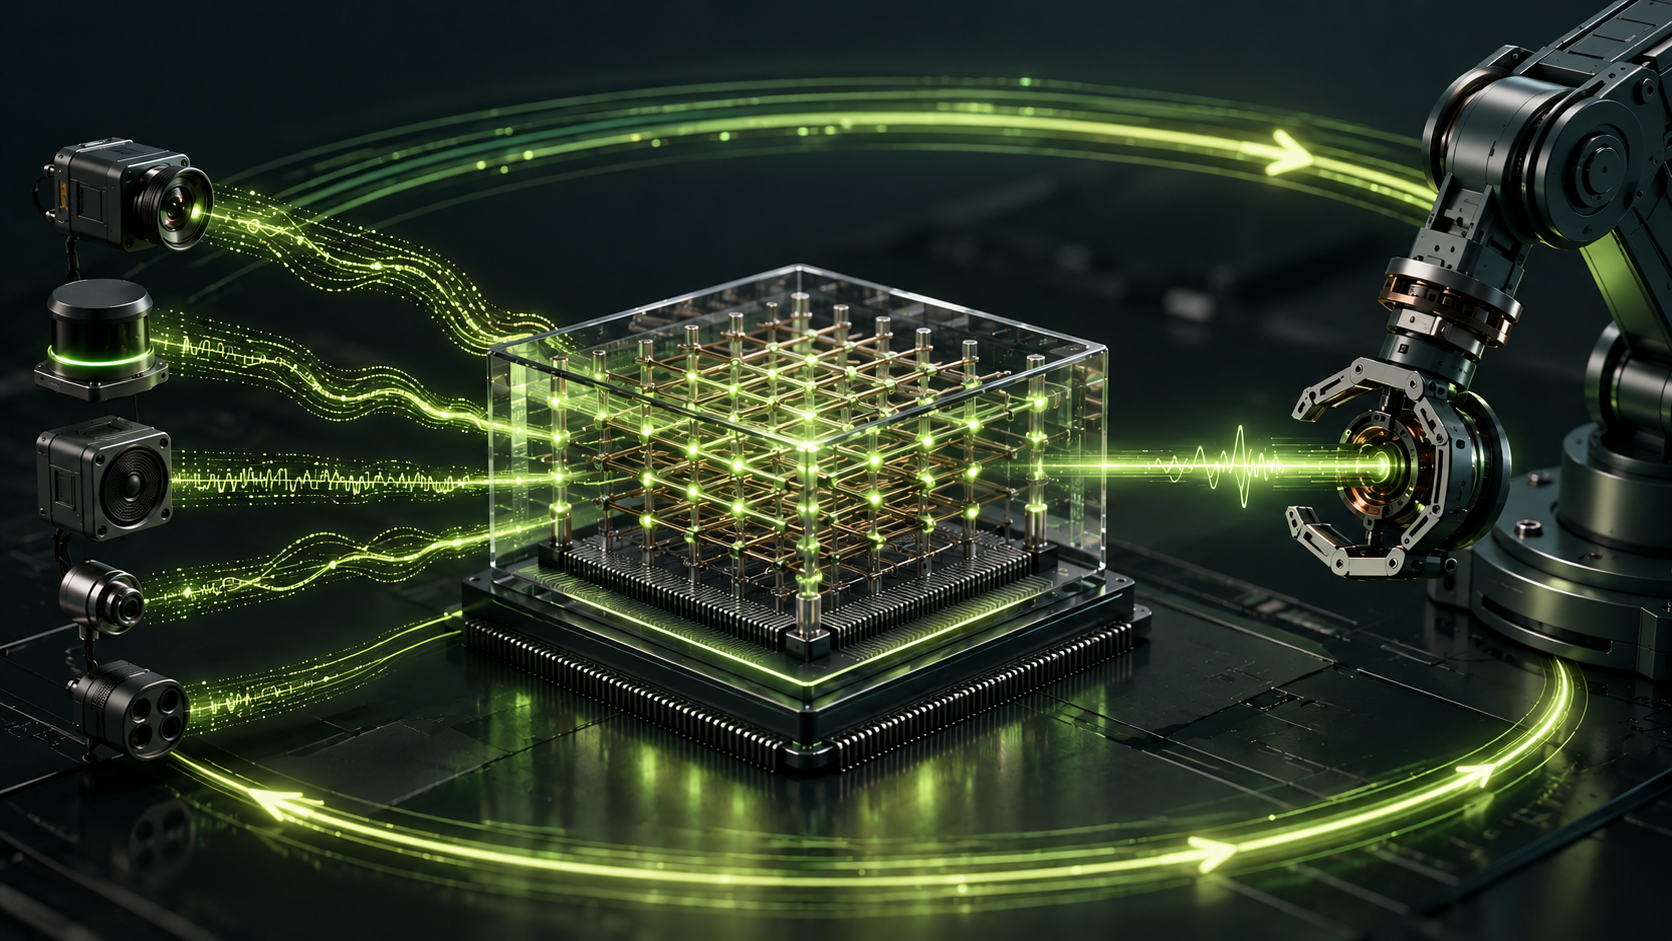
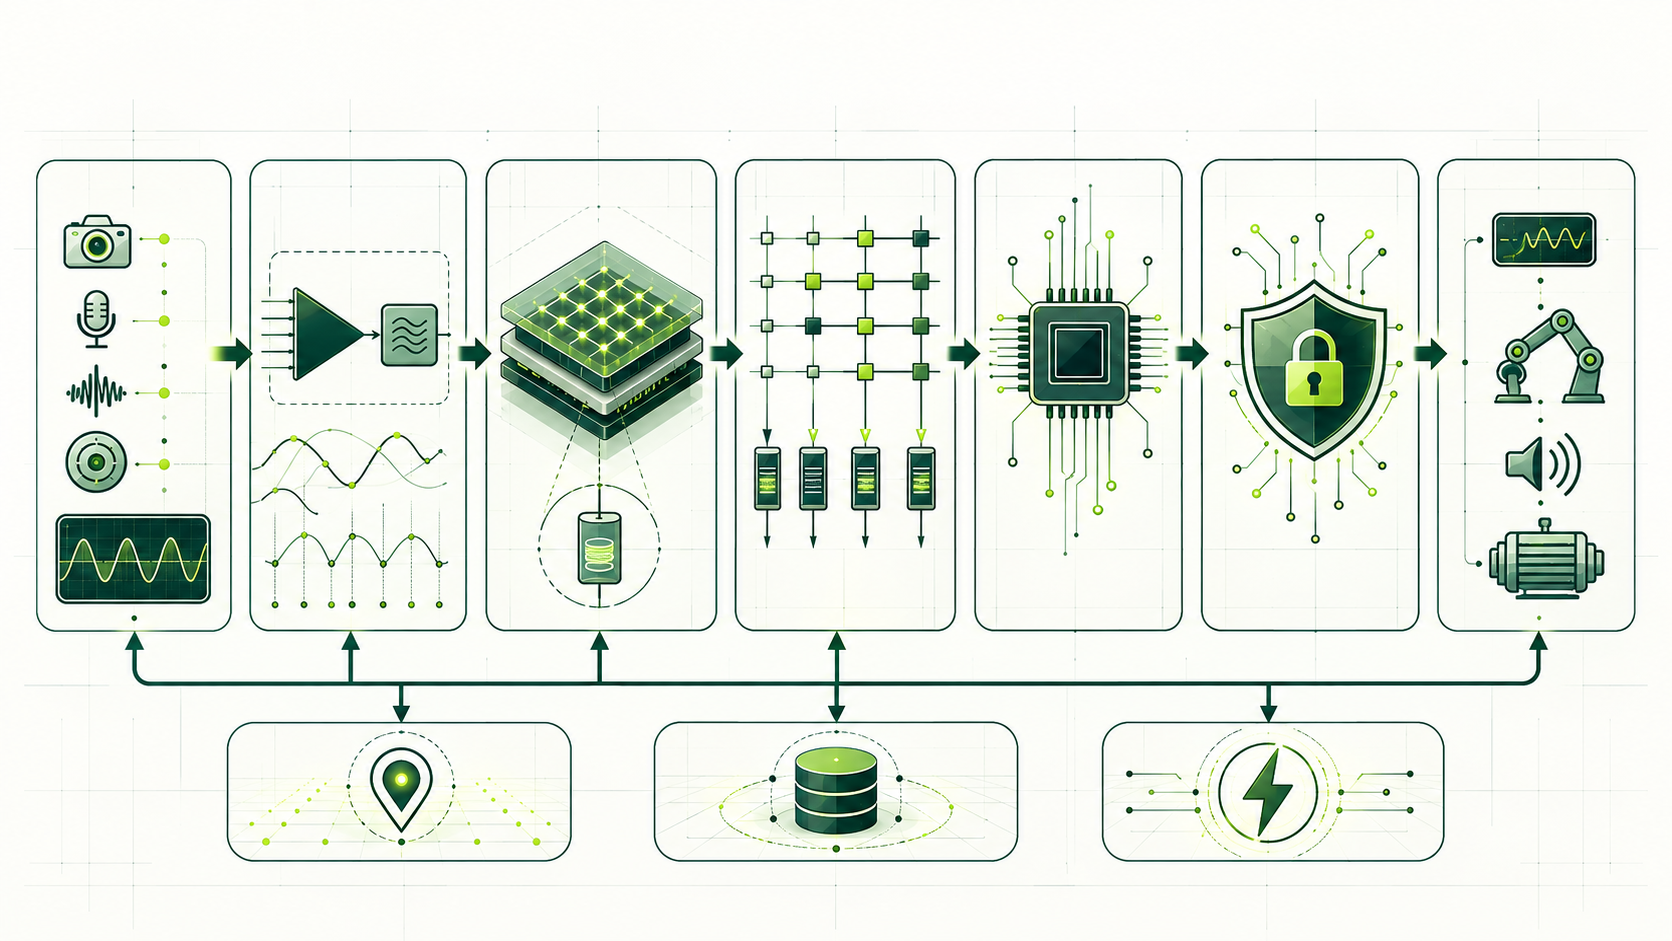
Sensor, preprocessing, DAC/array/ADC, local inference, decision and actuation measured on a matched workload.

Across all layers: authorized updates, audit trails, fail-safe behavior, batch variation, uncertainty and independent replication.
Array potential becomes a system benefit only when accuracy, peripheral energy and a matched workload are measured together. Device, simulation and end-to-end results remain distinct. Jiang et al. ↗
03 / FABRICATION & ACCEPTANCE
Procure IGZO devices, apply incoming QC, then integrate and calibrate. The draft planning range is 18–30 months.
Record films, electrodes, lithography, annealing and batch-level metrology with traceable process revisions. Draft range: 24–36 months.
Control specification and provenance while retaining independent incoming QC and system integration. Draft range: 24–36 months.
All routes require prespecified pass criteria, raw traces, rejected samples, batch variation and read-disturb measurements before progressing to 32×32. Moving to 64×64 is conditional. Decision gates ↗
04 / EXPERIMENTAL VALIDATION
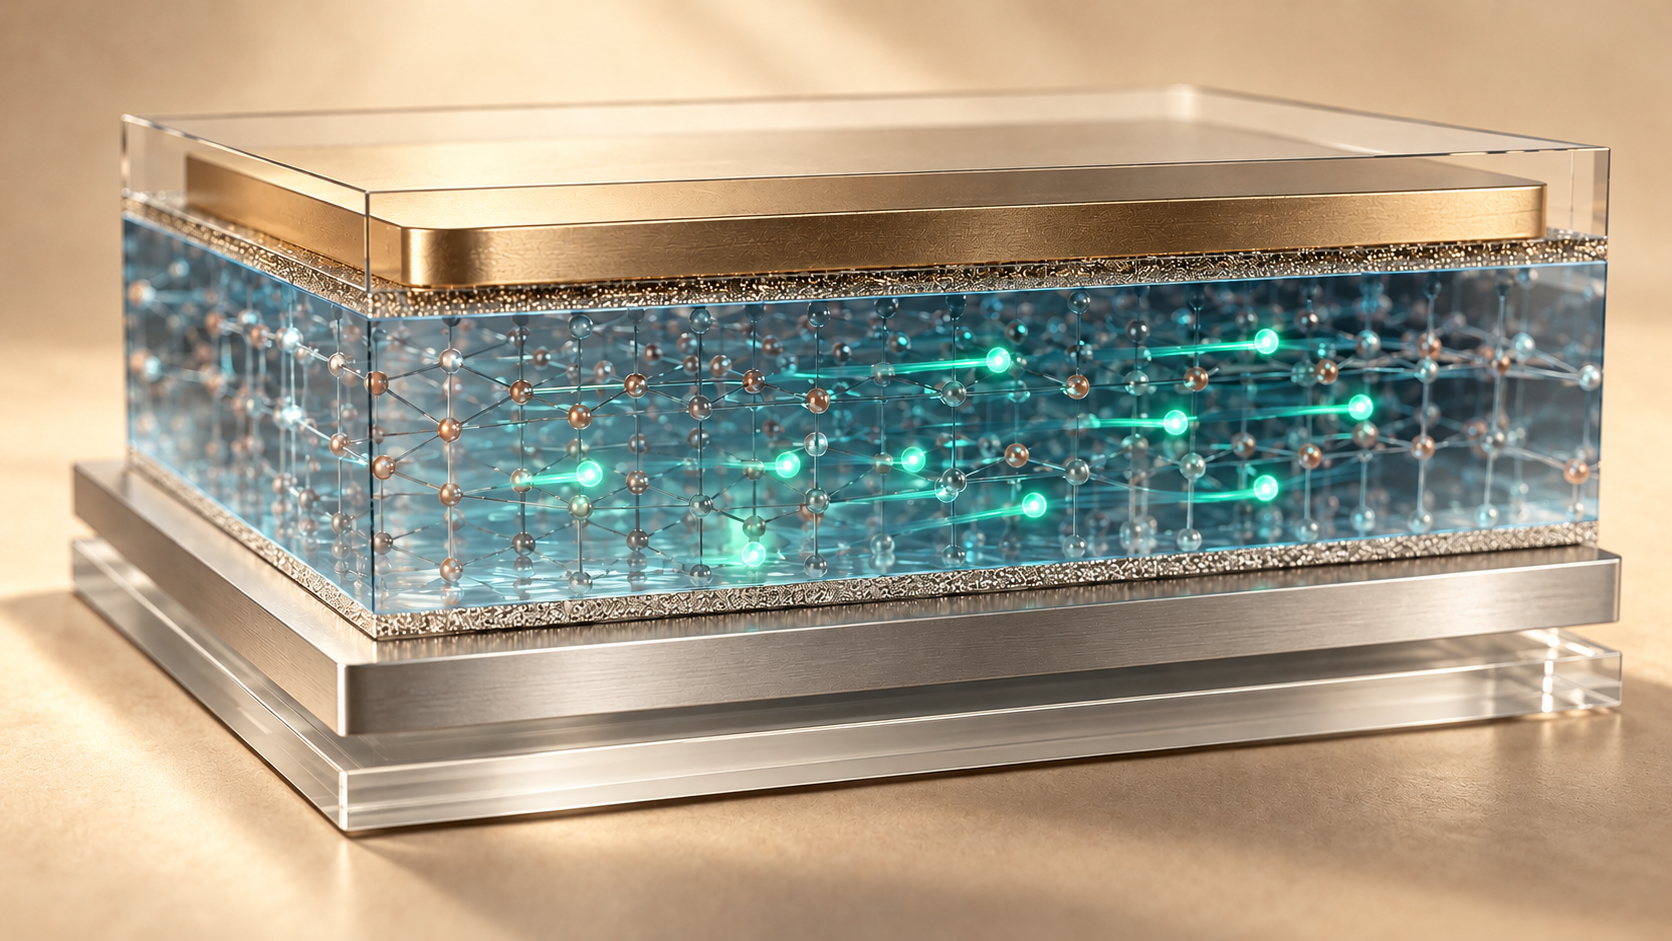
Test state separation, write/read energy, retention, endurance, cell and batch variability, yield, MVM error and calibration cost. Compare passive crossbar with 1T1R under matched accuracy targets.
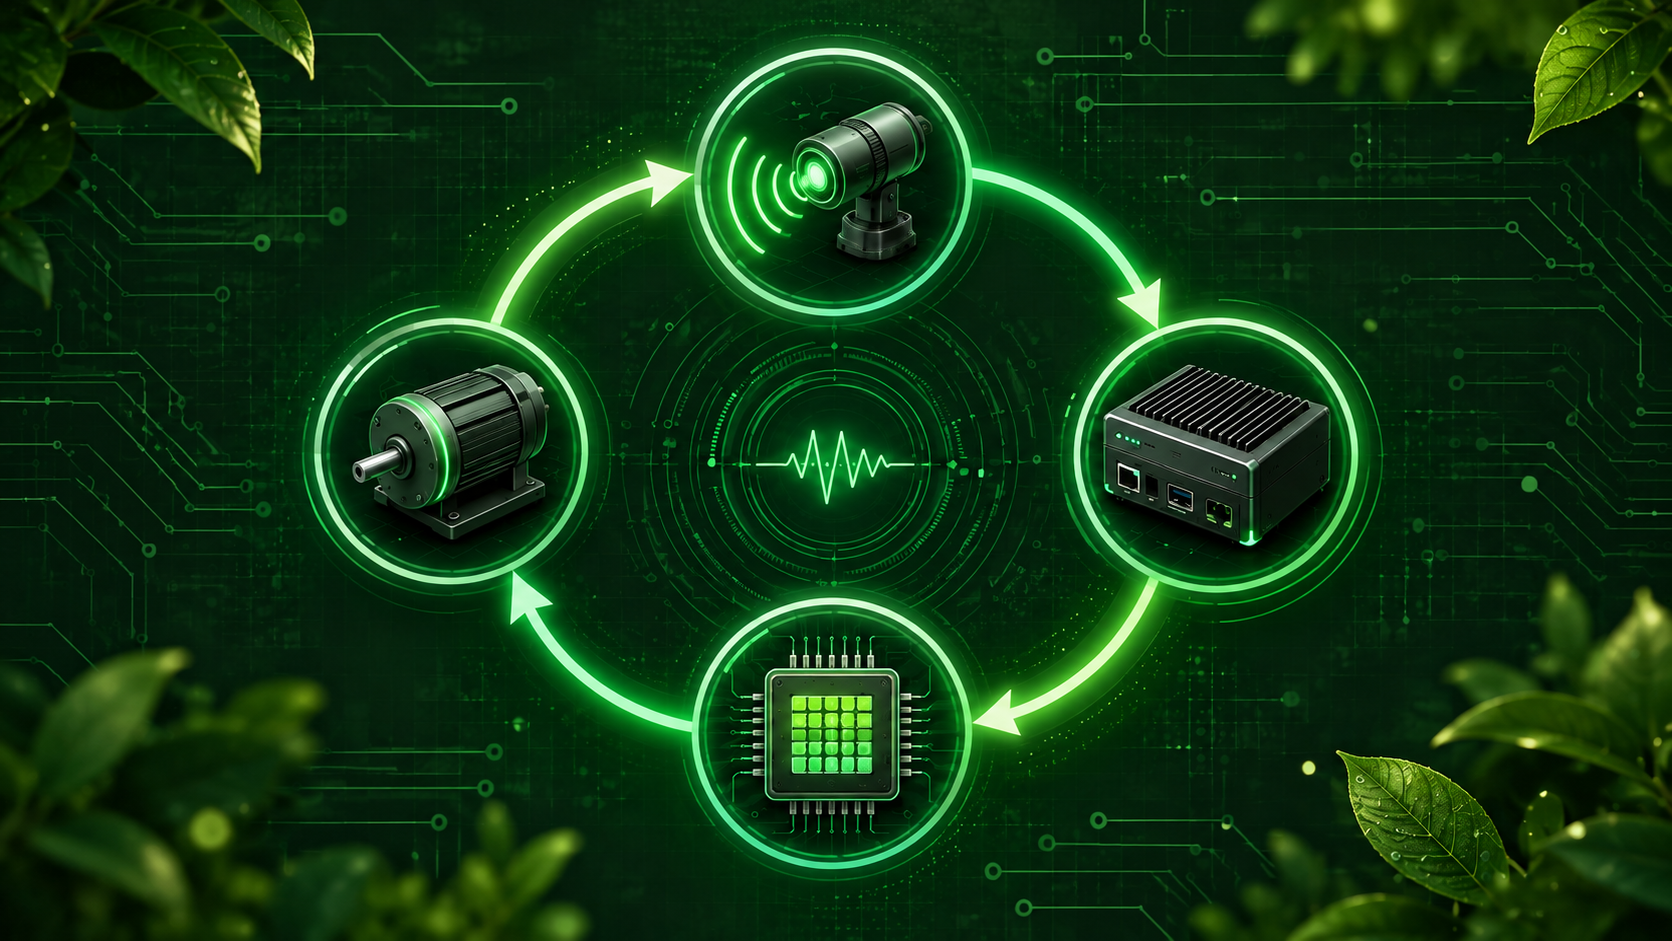
Measure p50/p95/p99 latency and energy per valid inference including sensor, preprocessing, converters, array, controller and actuator. Keep a task-matched digital baseline.
E_write = ∫ V(t)I(t)dt · E_infer = E_total / N_validLock data splits, sample and batch counts, instrument bandwidth, uncertainty method, environmental conditions and failure rules before measuring.
05 / MULTIDISCIPLINARY SYNTHESIS
Stoichiometry, oxygen chemistry, interfaces, process control and physical characterisation.
Line losses, selection, ADC/DAC, noise, power accounting and array scaling.
Hardware-aware training, quantisation, calibration, dataset leakage and matched accuracy.
Instrument traceability, nested batch sampling, uncertainty intervals and failure reporting.
Authorised updates, fault injection, safe states and documented AI risk management.
Energy per valid inference, idle power, process yield, maintenance and total cost boundaries.
06 / CLAIM CLASSIFICATION
Specific IGZO device and array results with stated structure, sample size and conditions. They are not results of the proposed platform.
Circuit or neural-network simulation, even when parameterised with measured device data. It does not establish complete hardware performance.
Latency, power, scaling and security goals that need preregistered tests and independent replication.
07 / INTERACTIVE FORMULATIONS
Iⱼ = Σᵢ VᵢGᵢⱼIgnores line resistance and device variation until these are added from measurement.
Eₜ = Eₛ + E_DAC + E_array + E_ADC + E_ctrlShows why an array-only value cannot support an end-to-end claim.
P(all pass) = pᴺIllustrative independence assumption only; manufacturing defects can be correlated.
NRMSE = √[Σ(I_meas−I_ref)² / ΣI_ref²]Show raw and post-calibration outputs separately.
Eᵢ = ∫P_system(t)dt / N_validDeclare the measurement interval and validity rule in advance.
L₉₅ = Q₀.₉₅(t_decision−t_sensor)A median alone hides slow decisions.
08 / TECHNICAL LIBRARY
Device physics, metrology, fabrication gates and claim corrections, with linked primary sources.
Download report ↓Crossbar error budgets, end-to-end energy, fair baselines, application safety and reproducibility.
Download report ↓The complete research programme is also available as a printable page.
09 / VISUAL ATLAS
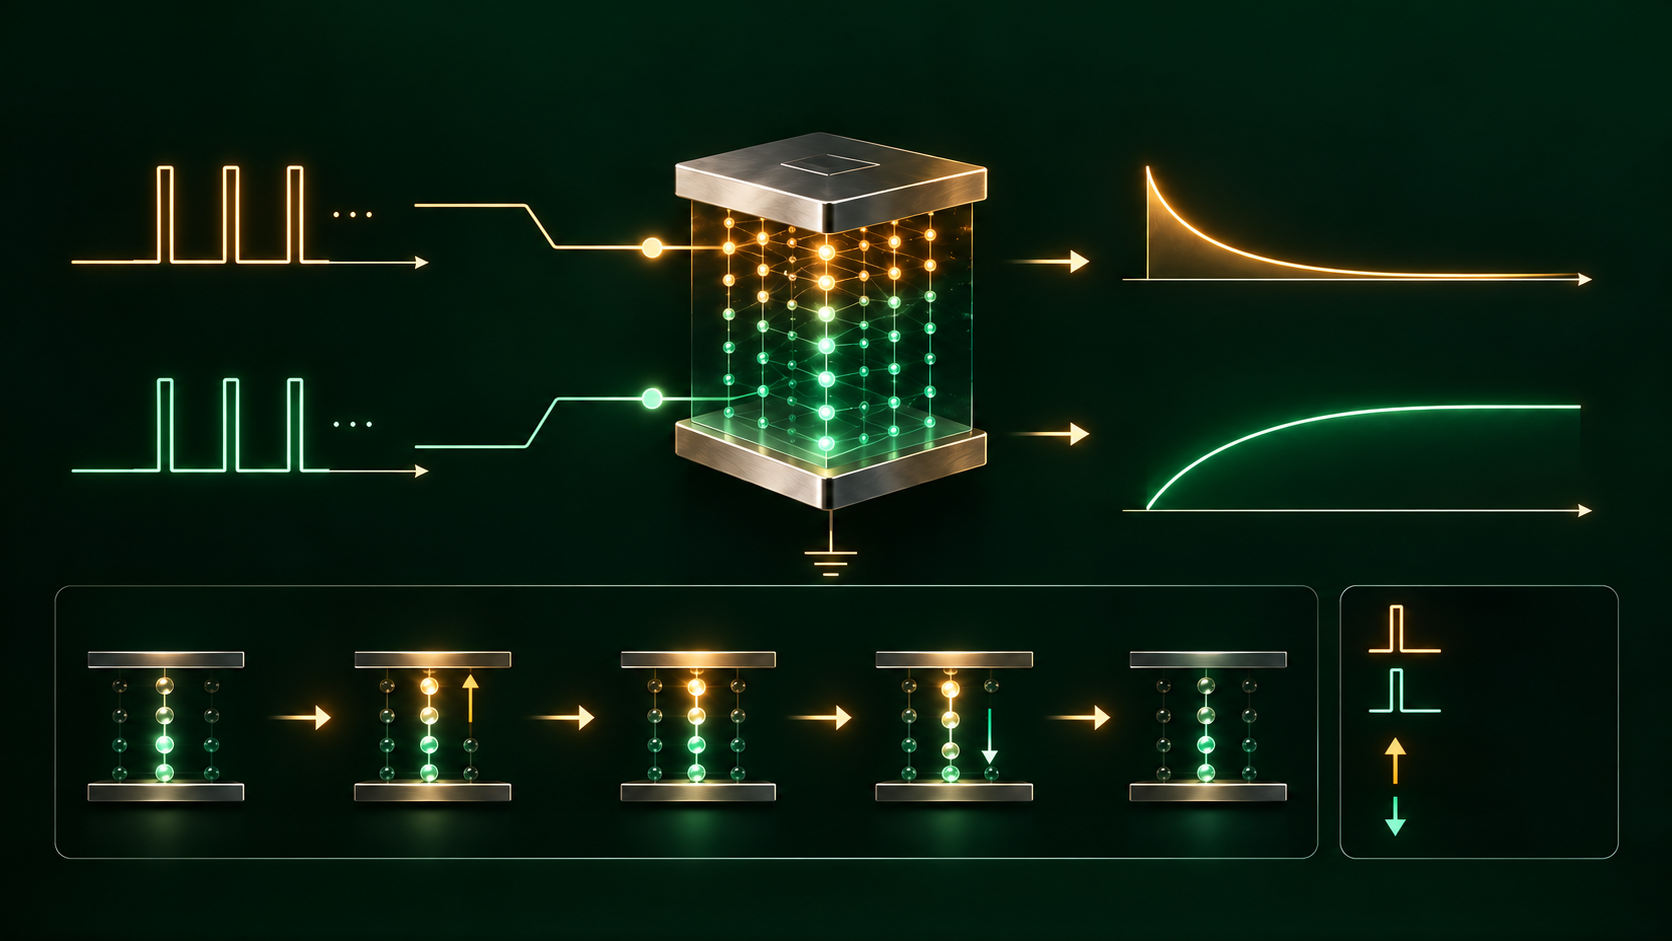
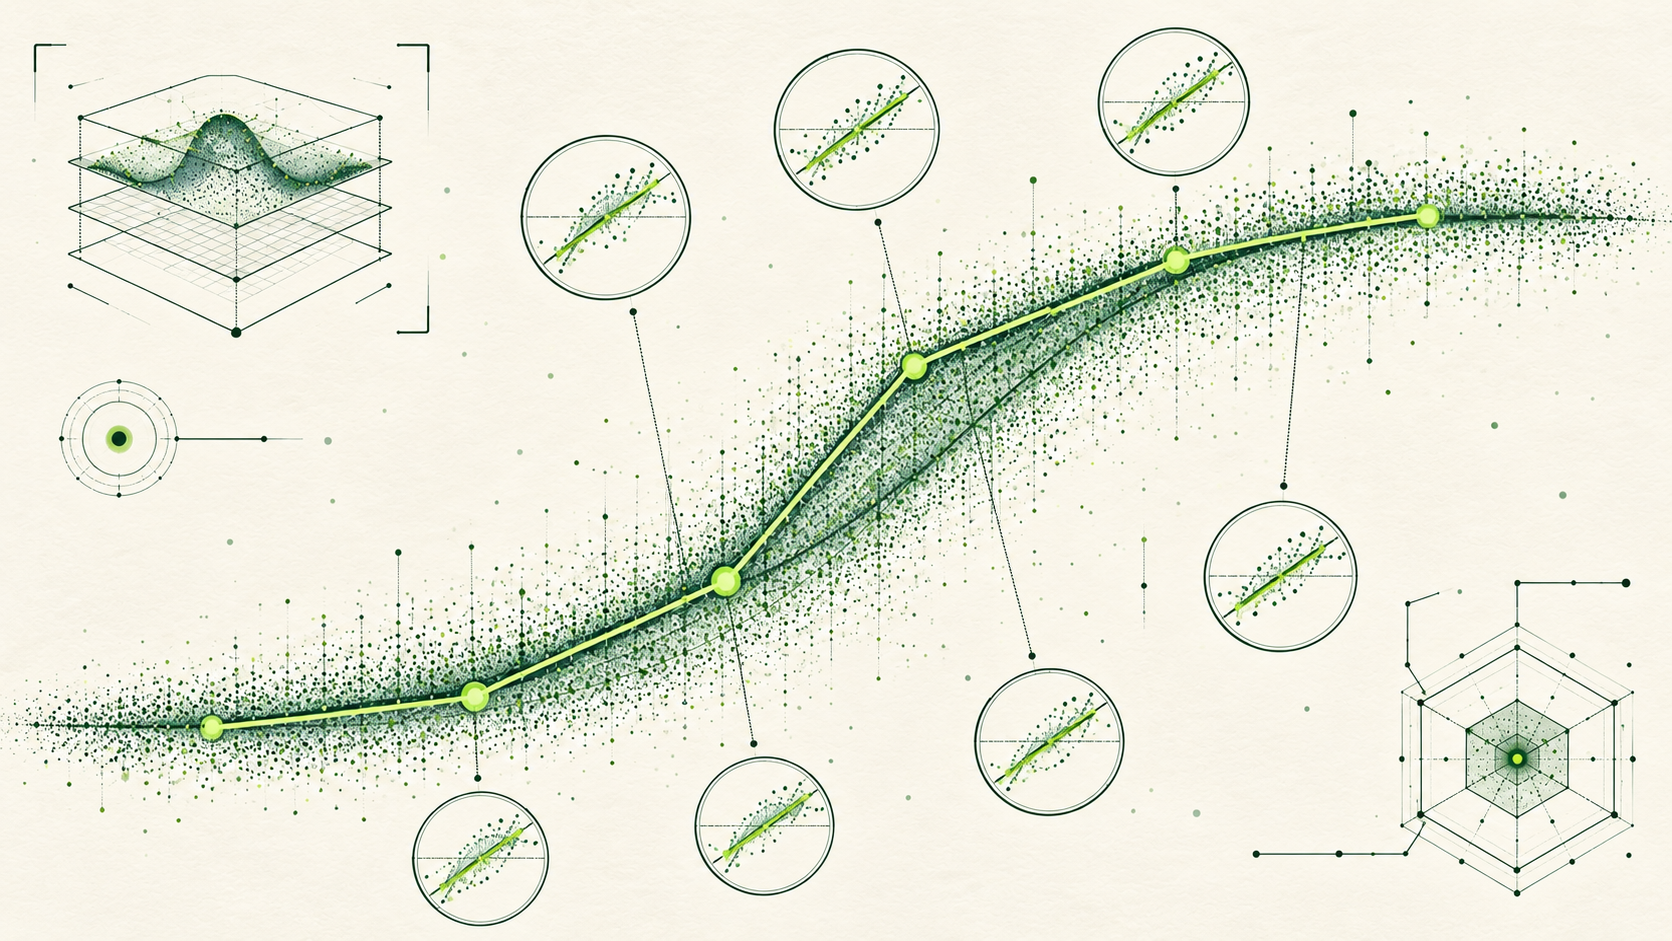
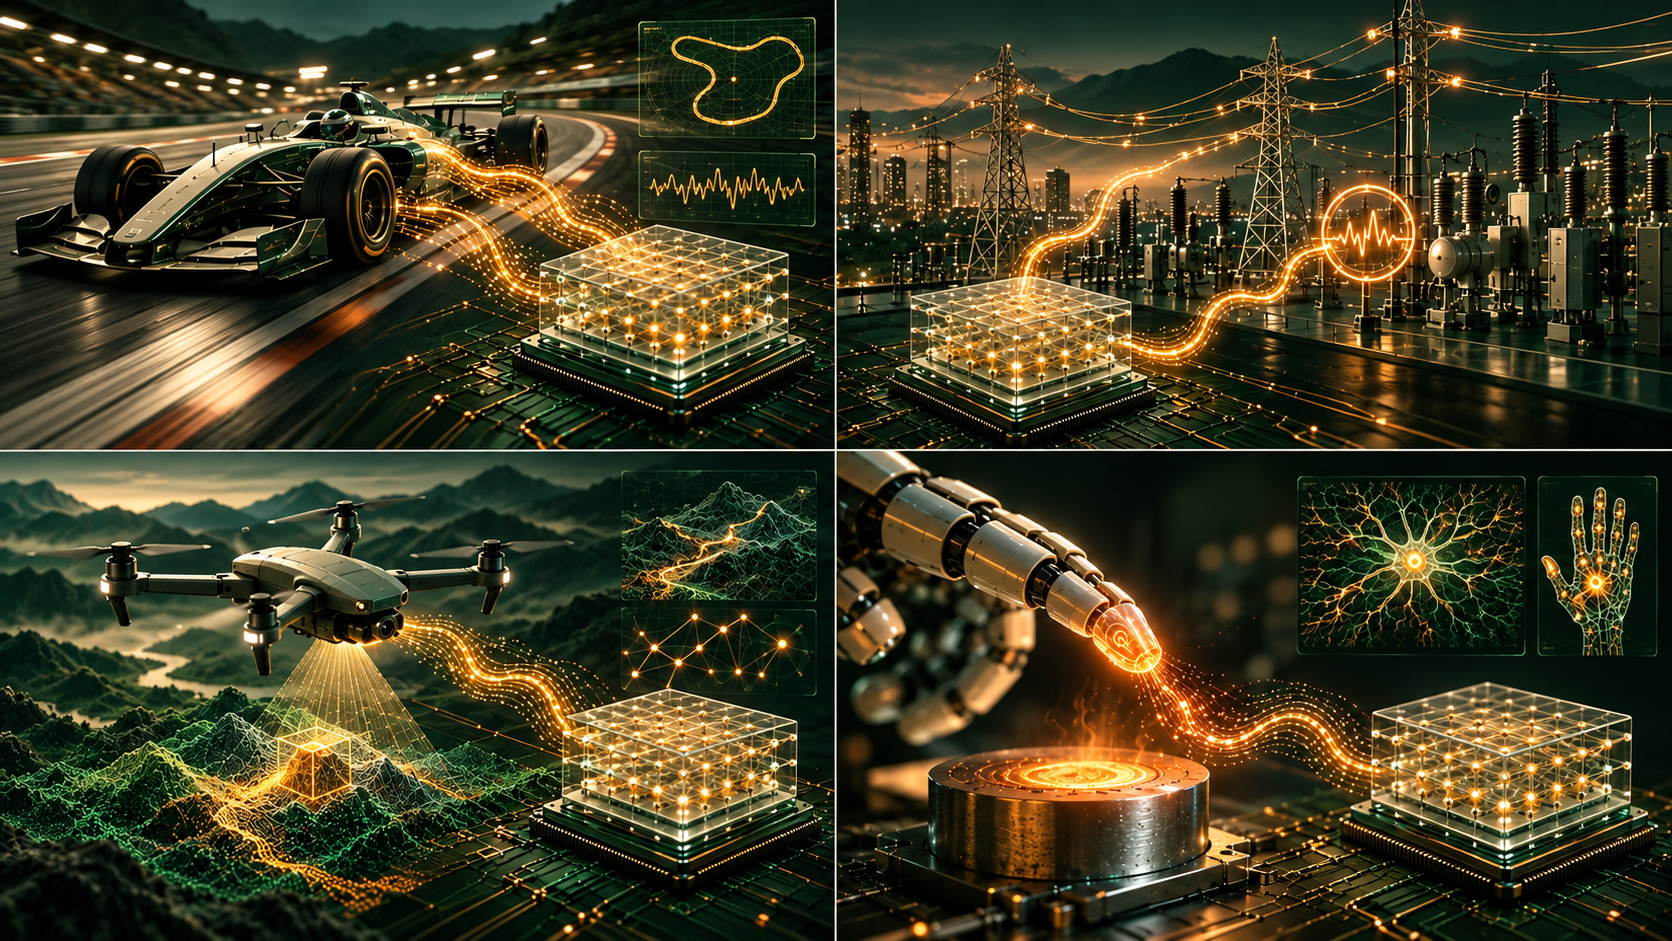
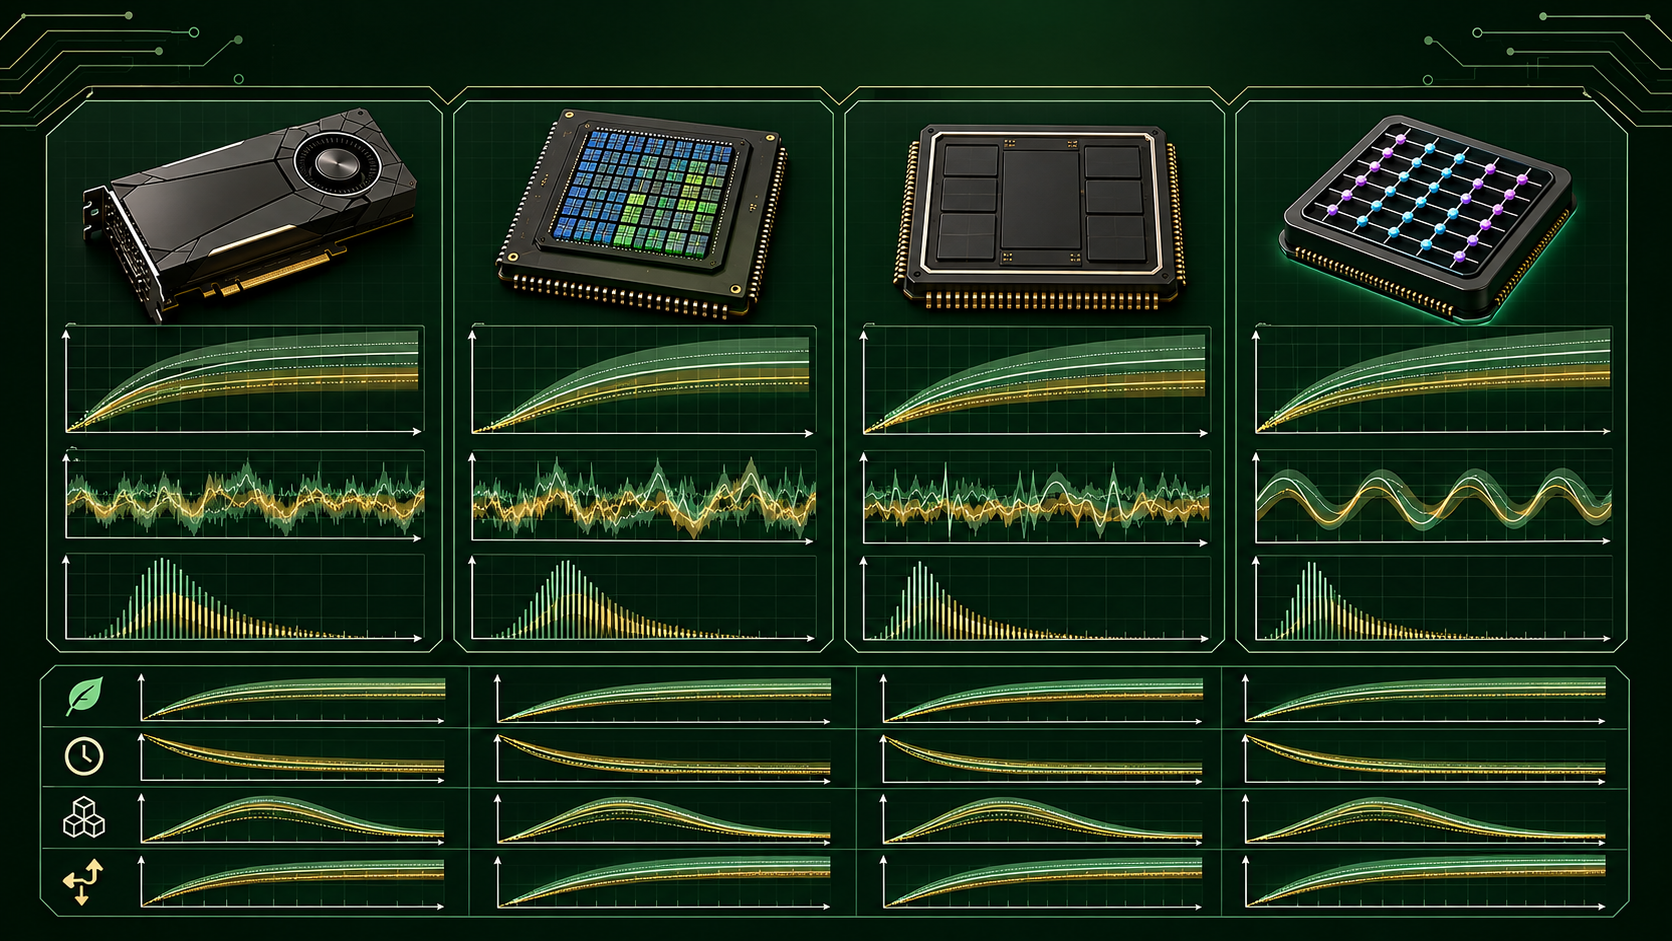
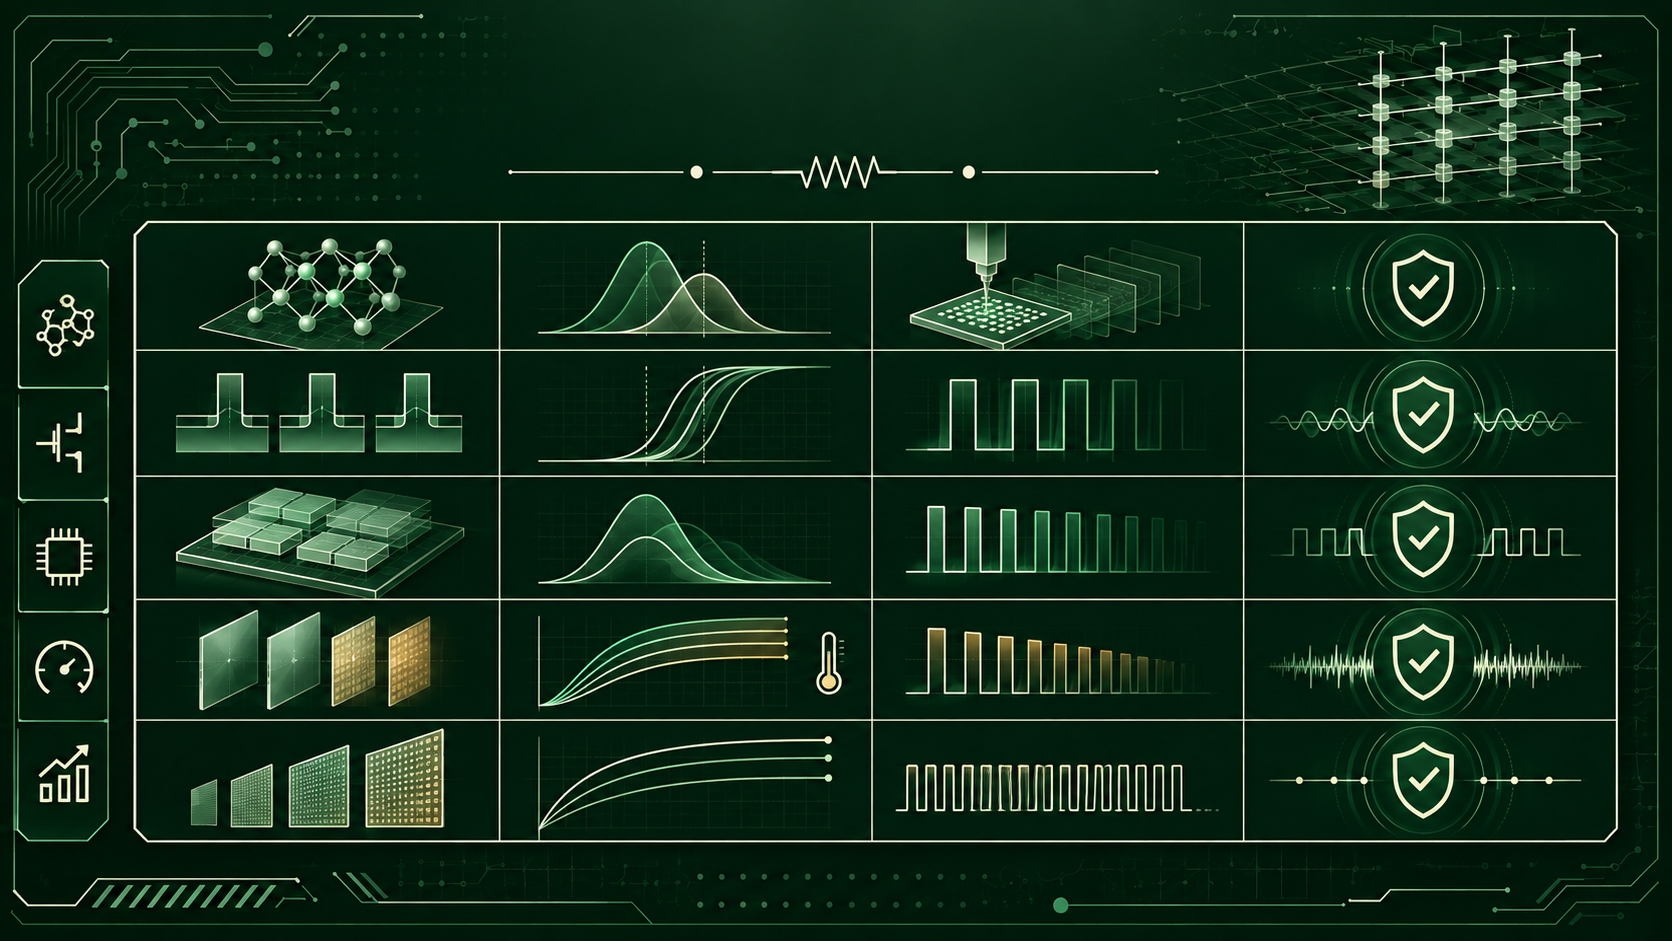
These images communicate research concepts. They are not device photographs, measured plots or validated prototype results.




PORTFOLIOS 1–2 / ADDITIONAL AUDIT
Both PDF portfolios contain 13 embedded files. Compiled volumes repeat some of the individual documents; repetition is not independent evidence. Commercial pitches, drafts, patent compilations and peer-reviewed experiments are classified separately.
Claims of 300× processor efficiency, 90% less cooling and PUE≈1.0 are project assertions. Chip, server and facility boundaries must be measured separately. The IEA estimates 415 TWh of global datacentre electricity in 2024 and a cooling share ranging from about 7% to over 30% by facility type.
IEA evidence ↗Motorsport, driver-state and brain–machine interface narratives are candidate research uses. The portfolios do not provide independent end-to-end validation of 1 ms, 1 W, 99% accuracy or deployment for this IGZO platform.
Test first on recorded data with participant/session separation and shadow-mode evaluation.
Wang et al. (2026) report a 1-kb Pt/IGZO/SiNₓ/Ta array with endurance above 10⁶ cycles and retention above 10⁶ s. That result belongs to a different device stack and does not establish the portfolio platform's performance.
Nature Communications ↗The portfolio's F1–F6 facets denote physics, computation, life/cognition, infrastructure, economy and governance; they are a conceptual lens rather than six validated hardware stages. The patent compilation documents claims and scope, not readiness or measured system performance. Private counterparties and contract terms remain outside this public atlas.
10 / REFERENCES